
![]()
A DSI implementation for the MOLGENIS Armadillo DataSHIELD Service.
You can use DSMolgenisArmadillo to analyse data shared in MOLGENIS Armadillo servers using DataSHIELD. DataSHIELD allows execution of a subset of analysis methods available in R. Methods such as:
ds.mean() ds.glm() ds.lmerSLMA()
For more detailed documentation check: https://cran.datashield.org/.
You can install the released version of DSMolgenisArmadillo from CRAN with:
install.packages("DSI")
install.packages("DSMolgenisArmadillo")
Make sure you install the DataSHIELD client (dsBaseClient) to perform the actual analysis. This needs to be a client which is version 6.0.0 or higher.
# install the DataSHIELD client
install.packages("dsBaseClient", repos = c("http://cran.datashield.org", "https://cloud.r-project.org/"), dependencies = TRUE)To use the DataSHIELD Armadillo client and perform analysis in DataSHIELD there a few basic steps you need to take.
# Load the necessary packages.
library(dsBaseClient)
#> Loading required package: DSI
#> Loading required package: progress
#> Loading required package: R6
library(DSMolgenisArmadillo)
#> Loading required package: MolgenisAuth

# specify server url
armadillo_url <- "https://armadillo.dev.molgenis.org"

# get token from central authentication server
token <- armadillo.get_token(armadillo_url)You need to specify the project, the folder and the table name(s) you want to access.
# build the login dataframe
builder <- DSI::newDSLoginBuilder()
builder$append(server = "armadillo",
               url = armadillo_url,
               token = token,
               table = "gecko/2_1-core-1_0/nonrep",
               driver = "ArmadilloDriver")

# create loginframe
logindata <- builder$build()Assigning the data means that you will assign the data to a symbol in the analysis environment.
# login into server
conns <- datashield.login(logins = logindata, symbol = "core_nonrep", variables = c("coh_country"), assign = TRUE)
#>
#> Logging into the collaborating servers
#>
#> Assigning table data...DataSHIELD has a range of methods you can use to perform analysis. Check: the dsBaseClient documentation to see which methods are available.
# calculate the mean
ds.mean("core_nonrep$coh_country", datasources = conns)
#> $Mean.by.Study
#>           EstimatedMean Nmissing Nvalid Ntotal
#> armadillo       431.105        0   1000   1000
#>
#> $Nstudies
#> [1] 1
#>
#> $ValidityMessage
#>           ValidityMessage
#> armadillo "VALID ANALYSIS"

# create a histogram
ds.histogram(x = "core_nonrep$coh_country", datasources = conns)
#> Warning: armadillo: 0 invalid cells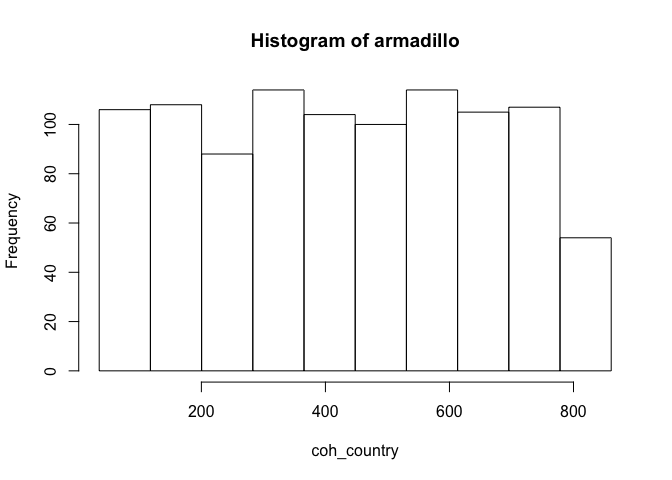
#> $breaks
#>  [1]  35.24049 117.79616 200.35183 282.90750 365.46318 448.01885 530.57452
#>  [8] 613.13019 695.68587 778.24154 860.79721
#>
#> $counts
#>  [1] 106 108  88 114 104 100 114 105 107  54
#>
#> $density
#>  [1] 0.0012839820 0.0013082081 0.0010659473 0.0013808863 0.0012597560
#>  [6] 0.0012113038 0.0013808863 0.0012718690 0.0012960951 0.0006541041
#>
#> $mids
#>  [1]  76.51832 159.07399 241.62967 324.18534 406.74101 489.29668 571.85236
#>  [8] 654.40803 736.96370 819.51938
#>
#> $xname
#> [1] "xvect"
#>
#> $equidist
#> [1] TRUE
#>
#> attr(,"class")
#> [1] "histogram"Check the package documentation for details.