![]()
![]()
One of the main advantages of using Generalised Linear Models is their interpretability. The goal of prettyglm is to provide a set of functions which easily create beautiful coefficient summaries which can readily be shared and explained.
You can install the development version from GitHub with:
To explore the functionality of prettyglm we will use a data set sourced from https://www.kaggle.com/volodymyrgavrysh/bank-marketing-campaigns-dataset which contains information about a Portugal banks marketing campaigns results. The campaign was based mostly on direct phone calls, offering clients a term deposit. The target variable y indicates if the client agreed to place the deposit after the phone call.
A critical step for this package to work well is to set all categorical predictors as factors.
# Easiest way to convert multiple columns to a factor.
columns_to_factor <- c('job',
                       'marital',
                       'education',
                       'default',
                       'housing',
                       'loan')
bank_data  <- bank_data  %>%
  dplyr::mutate_at(columns_to_factor, list(~factor(.))) %>% # multiple columns to factor
dplyr::mutate(age_cat = Hmisc::cut2(age, g=30, levels.mean=T)) #cut age variable into categoriesFor this example we will build a glm using stats::glm(), however prettyglm also supports parsnip and workflow model objects which use the glm model engine.
Note the point of this README is not to create the best model, but to highlight the features of this package.
deposit_model <- stats::glm(y ~ job +
                                marital +
                                education +
                                default +
                                loan +
                                age_cat,
                             data = bank_data,
family = binomial)pretty_coefficients()pretty_coefficients() automatically includes categorical variable base levels.type_iii argument.kable but setting Return_Data = TRUE

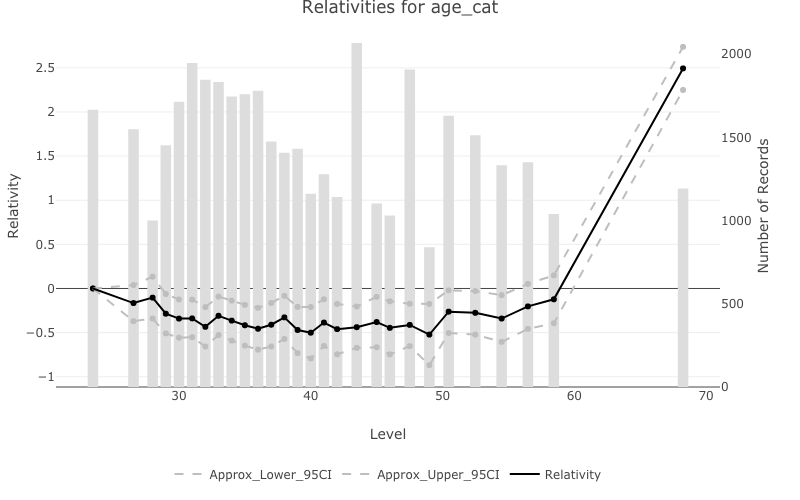
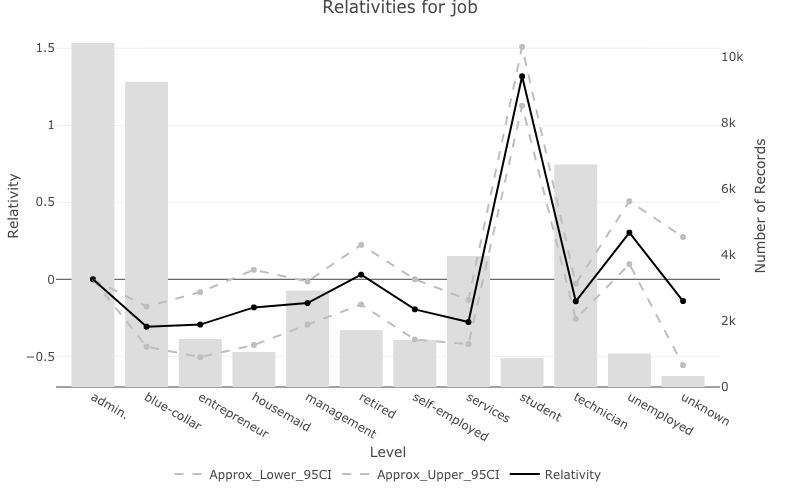
pretty_relativities()pretty_relativities() uses ‘exp(estimate)-1’ which is useful for GLM’s which use a log or logit link function.pretty_relativities() automatically extracts the training data from the model objects and plots the relativities and the number of records in the same plot.
pretty_relativities(feature_to_plot = 'age_cat',
                    model_object = deposit_model,
                    plot_factor_as_numeric = T)