r2rtf


Overview
r2rtf is an R package to create production-ready tables
and figures in RTF format. The R package is designed to
- provide simple “verb” functions that correspond to each component of
a table, to help you translate data frame(s) to a table in RTF
file.
- enables pipes (
%>%).
- only focus on table format.
- Data manipulation and analysis shall be handled by other R packages.
(e.g.,
tidyverse)
- minimizes package dependency
Installation
You can install the package via CRAN:
install.packages("r2rtf")
Or, install from GitHub:
remotes::install_github("Merck/r2rtf")
Highlighted Features
The R packager2rtf provided flexibility to enable
features below:
- Necessary options to create highly customized RTF table and
figure.
- Simple to use parameters and data structure.
- Customized column header: split by
"|".
- Three required parameters for the output tables (data, filename,
column relative width).
- Flexible and detail control of table structure.
- Format control in cell, row, column and table level for:
- Border Type: single, double, dash, dot, etc.
- Alignment: left, right, center, decimal.
- Column width.
- Text appearance: bold, italics,
strikethrough, underline and any combinations.
- Font size.
- Text and border color (657 different colors named in
color() function).
- Special characters: any character in UTF-8 encoding (e.g., Greek,
Symbol, Chinese, Japanese, Korean).
- Append several tables into one file.
- Pagination.
- Built-in raw data for validation.
Simple Example
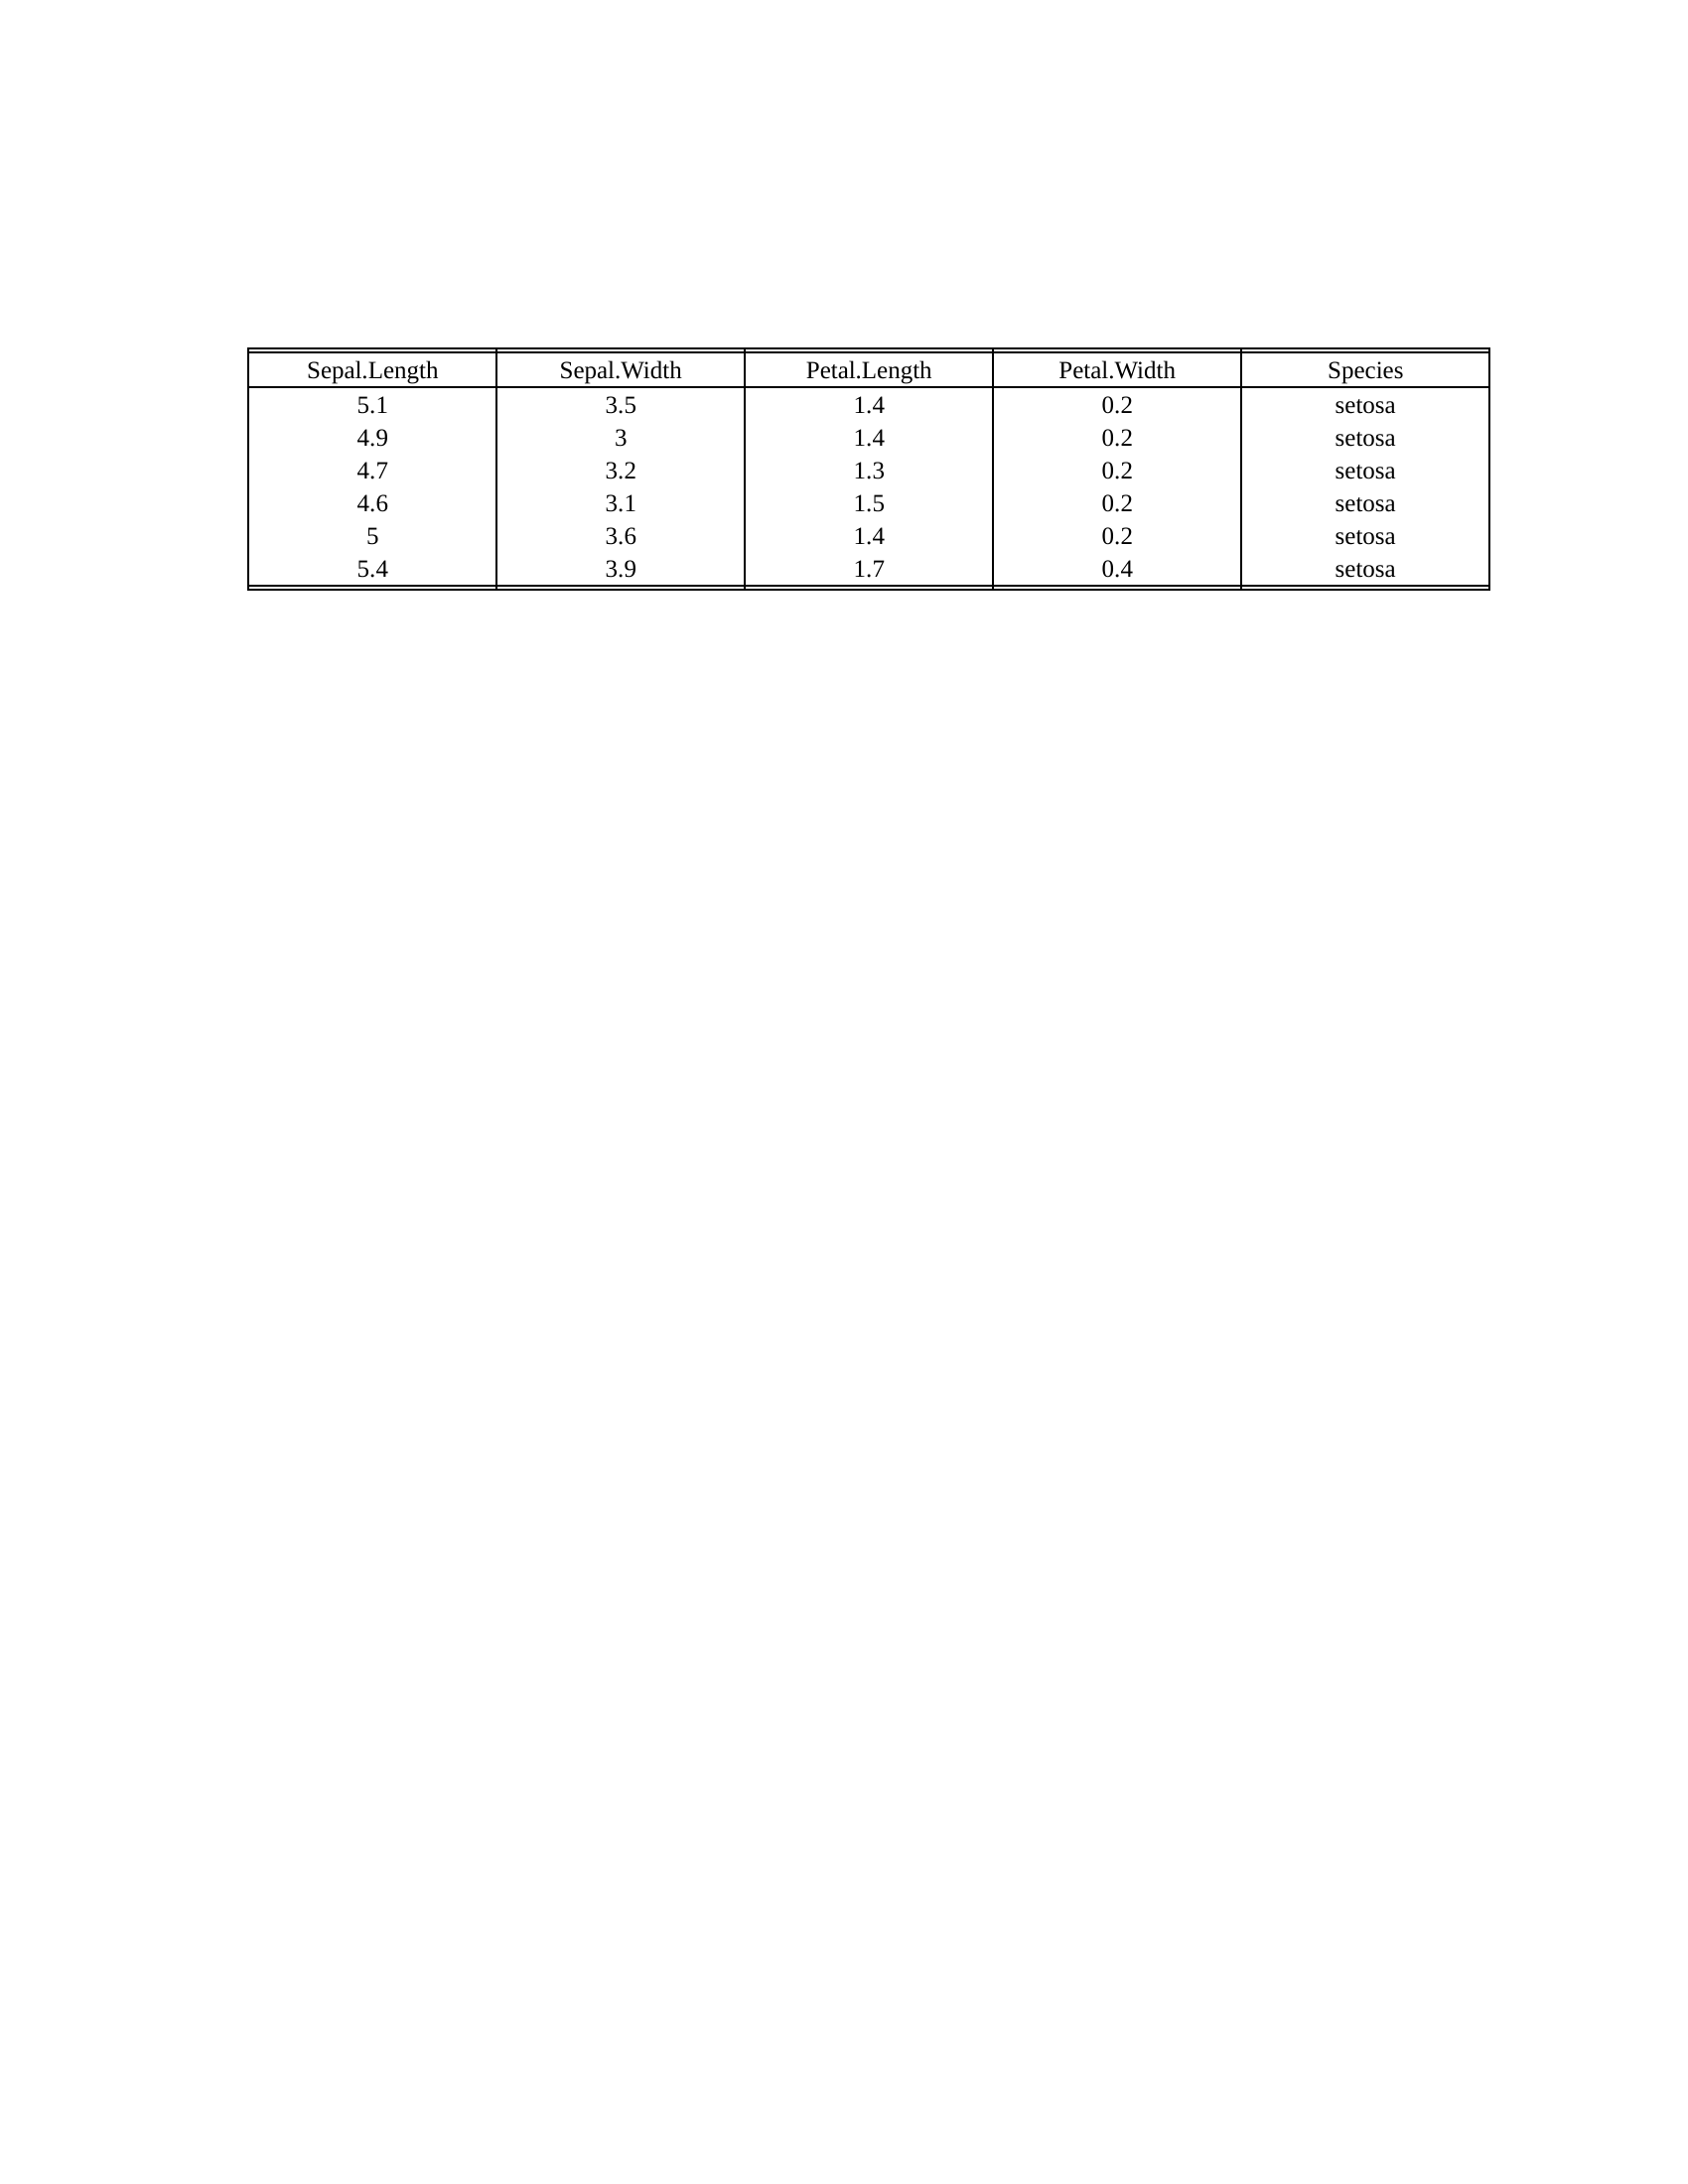
library(dplyr)
library(r2rtf)

head(iris) %>%
  rtf_body() %>%                 # Step 1 Add attributes
  rtf_encode() %>%               # Step 2 Convert attributes to RTF encode
  write_rtf(file = "ex-tbl.rtf") # Step 3 Write to a .rtf file
Click here to see the output

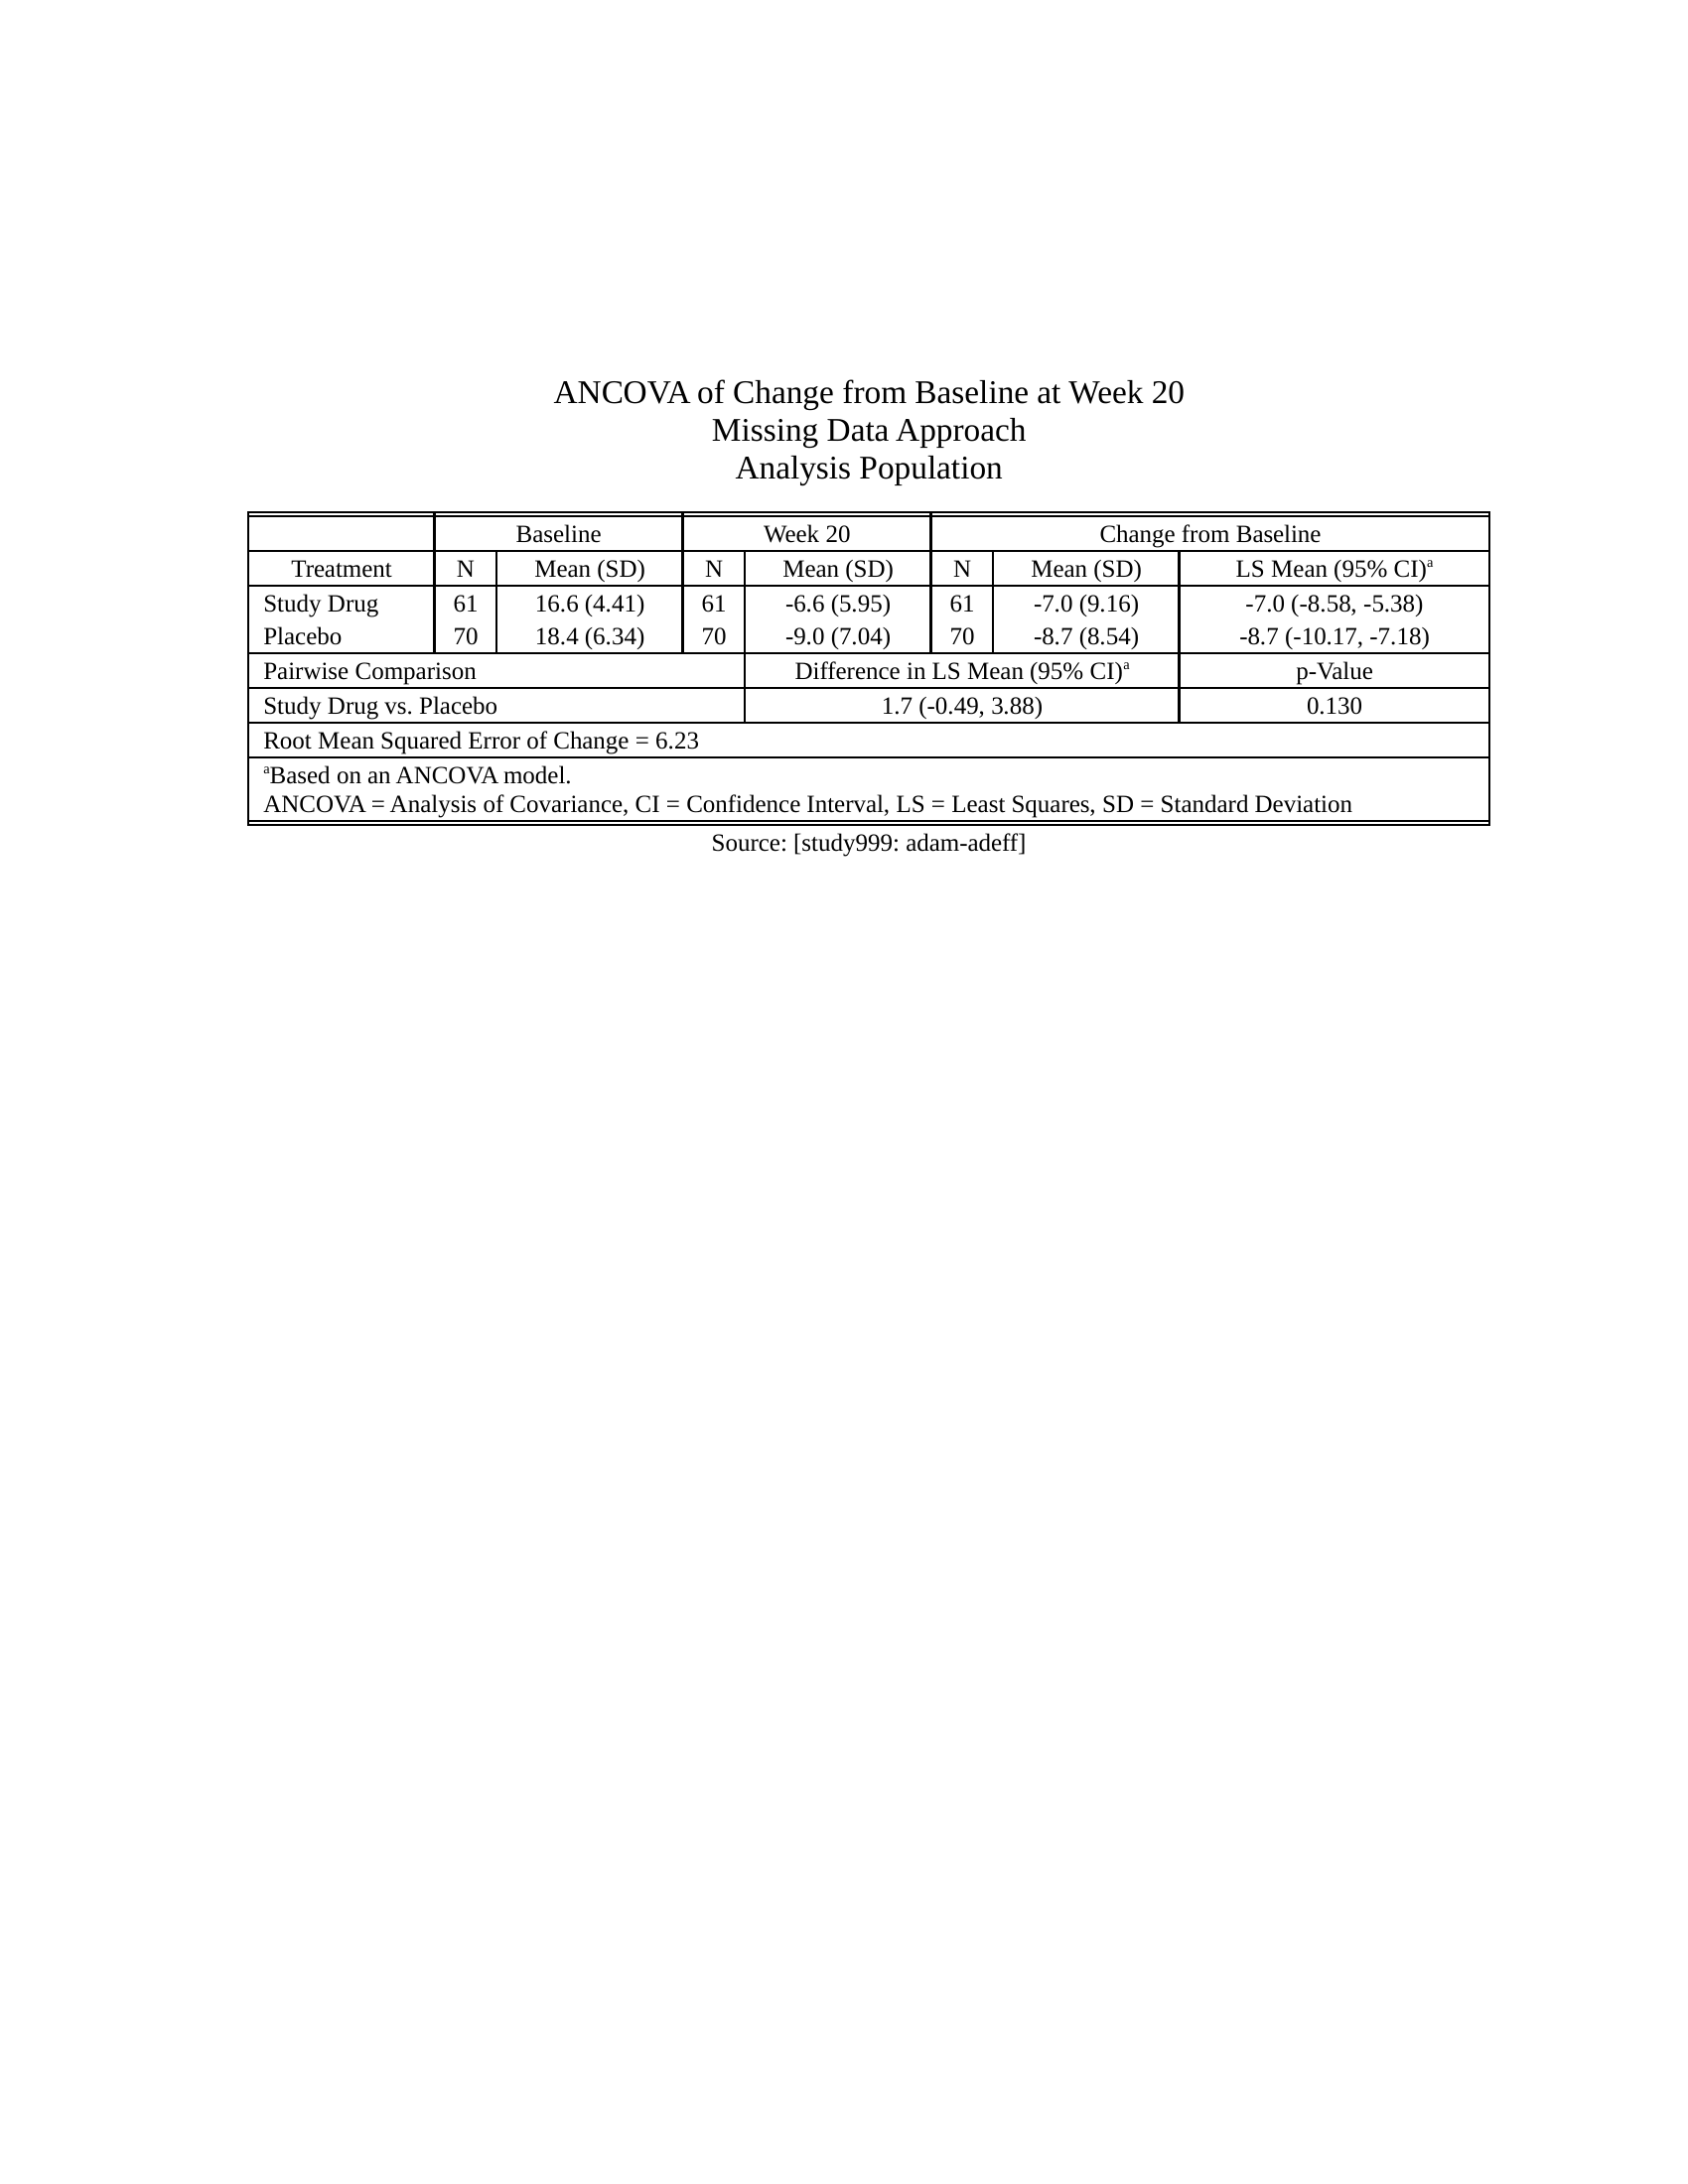
Example Efficacy Table
Click here to see the output

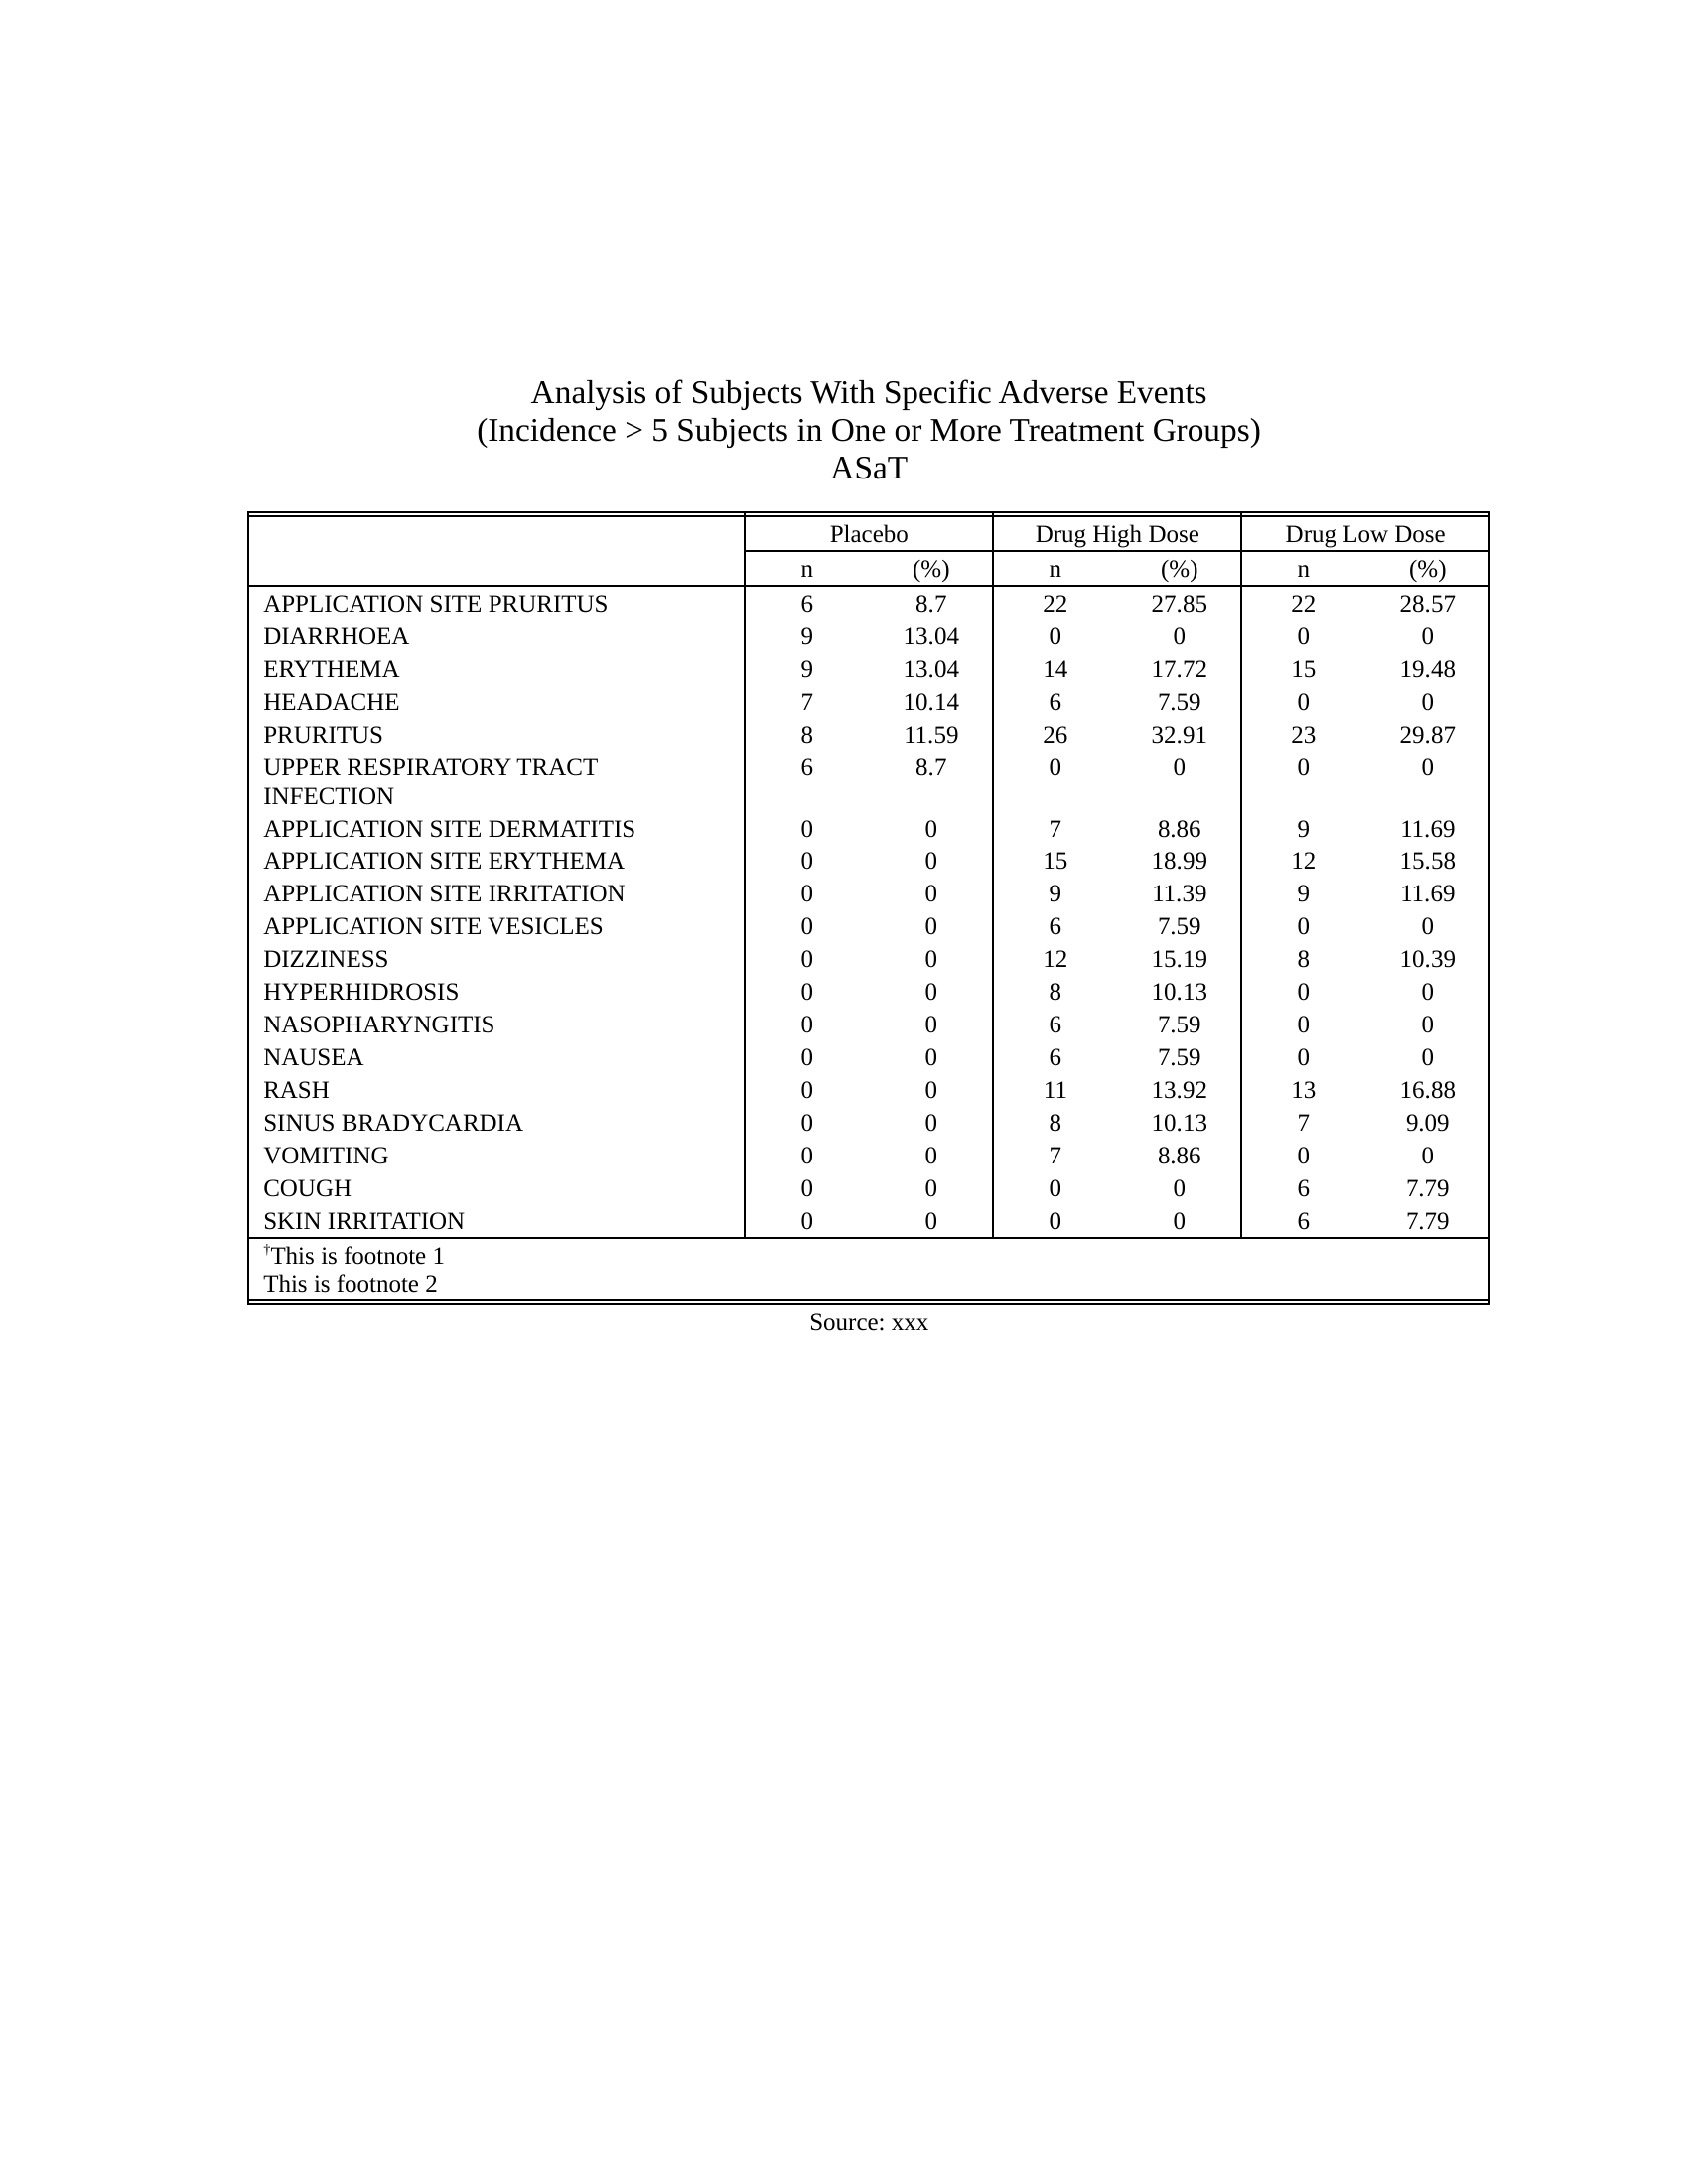
Example Safety Table
Click here to see the output


