![]()
![]()

![]()
Simple Principal Components Analysis (PCA) and Correspondence Analysis (CA) based on the Singular Value Decomposition (SVD). This package provides S4 classes and methods to compute, extract, summarize and visualize results of multivariate data analysis. It also includes methods for partial bootstrap validation.
There are many very good packages for multivariate data analysis (such as FactoMineR, ade4, vegan or ca, all extended by FactoExtra). dimensio is designed to be as simple as possible, providing all the necessary tools to explore the results of the analysis.
You can install the released version of dimensio from CRAN with:
install.packages("dimensio")And the development version from GitHub with:
# install.packages("remotes")
remotes::install_github("tesselle/dimensio")## Load packages
library(dimensio)
library(ggplot2)
library(ggrepel)
library(khroma)## Load data
data(iris)
## Compute PCA
## (non numeric variables are automatically removed)
X <- pca(iris, center = TRUE, scale = TRUE)
#> 1 qualitative variable was removed: Species.dimensio provides several methods to extract the results:
get_data() returns the original data.get_contributions() returns the contributions to the
definition of the principal dimensions.get_coordinates() returns the principal or standard
coordinates.get_correlations() returns the correlations between
variables and dimensions.get_cos2() returns the cos2 values (i.e. the
quality of the representation of the points on the factor map).get_eigenvalues() returns the eigenvalues, the
percentages of variance and the cumulative percentages of variance.The package allows to quickly visualize the results:
plot_rows()/plot_individuals() displays
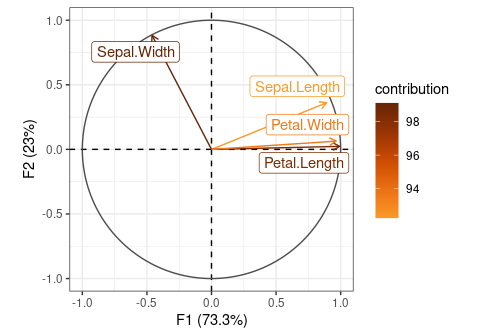
row/individual principal coordinates.plot_columns()/plot_variables() displays
columns/variable principal coordinates. plot_variables()
depicts the variables by rays emanating from the origin (both their
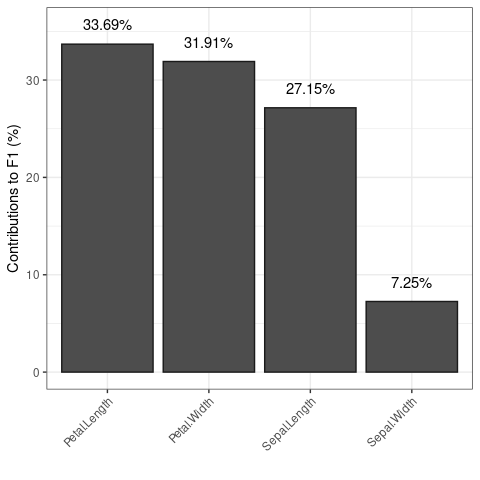
lengths and directions are important to the interpretation).plot_contributions() displays (joint)
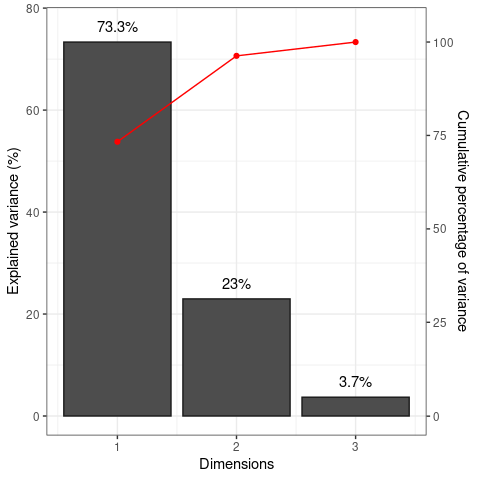
contributions.plot_cos2() displays (joint) cos2.plot_variance() produces a scree plot.dimensio uses ggplot2
for plotting informations. Visualization methods produce graphics with
as few elements as possible: this makes it easy to customize diagrams
(e.g. using extra layers, themes and scales). The plot_*()
functions allow to highlight additional information by varying different
graphical elements (color, transparency, shape and size of
symbols…).
## Form biplot
biplot(X, type = "form", label = "variables") +
  ggrepel::geom_label_repel() + # Add repelling labels
  ggplot2::theme_bw() + # Change theme
  ggplot2::theme(legend.position = "none") +
  khroma::scale_colour_highcontrast() # Custom color scale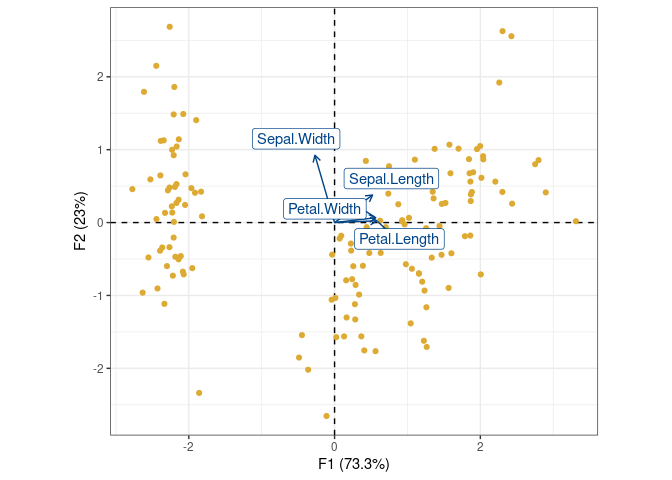
## Highlight species
plot_individuals(X, colour = "group", group = iris$Species) +
ggplot2::stat_ellipse() + # Add ellipses
ggplot2::theme_bw() + # Change theme
khroma::scale_colour_highcontrast() # Custom color scale
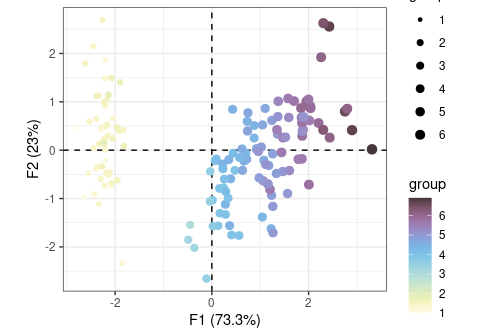
## Highlight petal length
plot_individuals(X, colour = "group", size = "group", group = iris$Petal.Length) +
ggplot2::theme_bw() + # Change theme
ggplot2::scale_size_continuous(range = c(1, 3)) + # Custom size scale
khroma::scale_color_iridescent() # Custom color scale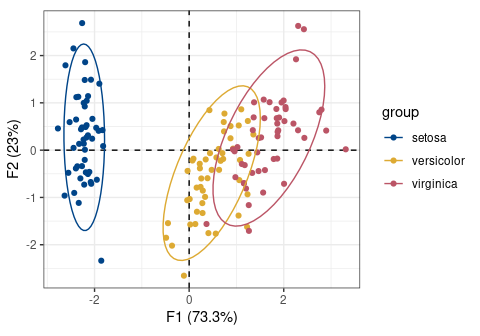
## Plot variables factor map
plot_variables(X) +
  ggrepel::geom_label_repel() + # Add repelling labels
  ggplot2::theme_bw() # Change theme

## Highlight contributions
plot_variables(X, colour = "contrib") +
  ggrepel::geom_label_repel() + # Add repelling labels
  ggplot2::theme_bw() + # Change theme
  khroma::scale_color_YlOrBr(range = c(0.5, 1)) # Custom color scale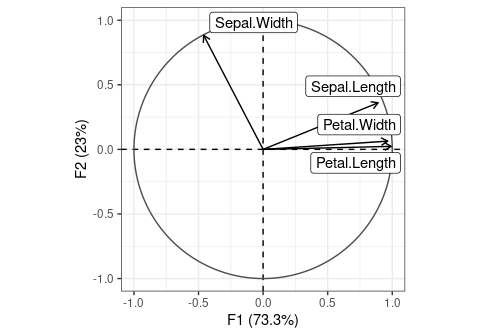
## Scree plot
plot_variance(X, variance = TRUE, cumulative = TRUE) +
  ggplot2::geom_text(nudge_y = 3) + # Add labels
  ggplot2::theme_bw() # Change theme

## Plot variables contributions to the definition of the first component
plot_contributions(X, margin = 2, axes = 1) +
  ggplot2::geom_text(nudge_y = 2) + # Add labels
  ggplot2::theme_bw() + # Change theme
  ggplot2::theme( # Edit theme
    # Rotate x axis labels
    axis.text.x = ggplot2::element_text(angle = 45, hjust = 1, vjust = 1)
  )
Please note that the dimensio project is released with a Contributor Code of Conduct. By contributing to this project, you agree to abide by its terms.